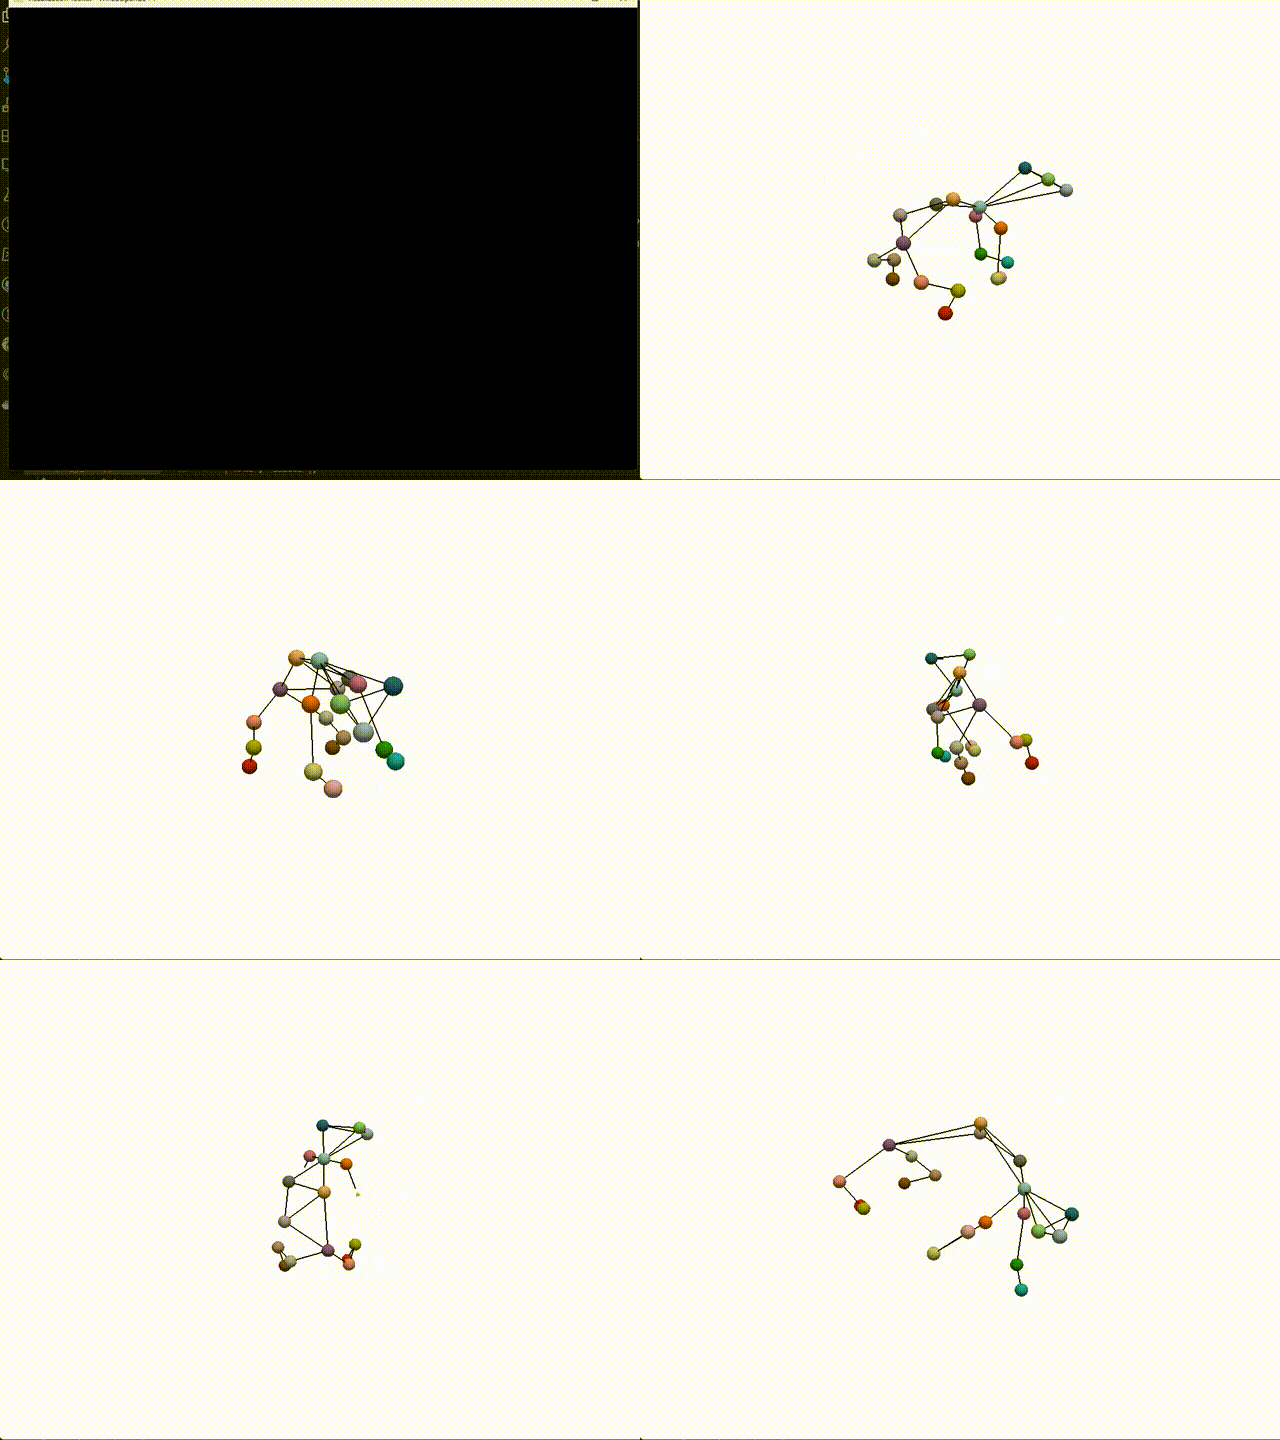
Visualizing and Animating 3D Motion Capture Data with PyVista
3D visualization is crucial for understanding complex data structures and models, especially in the realm of physics, engineering, and computer graphics. Motion capture data, in particular, is heavily used in film industry, game development, biomedical research, computational ethology and sports science. Matplotlib has been the go-to library for many Python users due to its simplicity and extensive features. However, for 3D visualization, particularly for rendering and animating motion capture data, we hit a snag. The rendering process in Matplotlib is quite slow and often becomes impractical when dealing with a large number of frames. This is where PyVista comes into play.
PyVista is a 3D visualization and analysis library that provides a streamlined, Pythonic interface to the Visualization Toolkit (VTK). It is capable of creating high quality 3D visualizations and animations with high frame rates, making it an excellent choice for visualizing motion capture data.
1. Setting Up The Scene
The first step in visualizing 3D motion capture data is to set up the scene. This involves creating the 3D body parts and skeleton connections, and initializing the plotter.
import pyvista as pv

def create_body_part_mesh(x, y, z, radius=5):
    return pv.Sphere(radius=radius, center=(x, y, z))

def create_skeleton_line(x1, y1, z1, x2, y2, z2):
    return pv.Line((x1, y1, z1), (x2, y2, z2))

plotter = pv.Plotter(notebook=False, off_screen=False)
2. Loading Motion Capture Data
Next, we load the motion capture data and add each body part and skeleton connection to the plotter. The data usually comes in a structured format where each row represents a frame and each column represents a body part or a skeleton connection.
frame_rate = 30
for num in range(num_frames):
    plotter.clear()
    for body_part in body_parts:
        x = df.loc[num, f'{body_part}_x']
        y = df.loc[num, f'{body_part}_y']
        z = df.loc[num, f'{body_part}_z']
        mesh = create_body_part_mesh(x, y, z)
        plotter.add_mesh(mesh, color="red")

    for connection in skeleton:
        part1 = connection[0]
        part2 = connection[1]
        x1, y1, z1 = df.loc[num, f'{part1}_x'], df.loc[num, f'{part1}_y'], df.loc[num, f'{part1}_z']
        x2, y2, z2 = df.loc[num, f'{part2}_x'], df.loc[num, f'{part2}_y'], df.loc[num, f'{part2}_z']
        skl_mesh = create_skeleton_line(x1, y1, z1, x2, y2, z2)
        plotter.add_mesh(skl_mesh, color="blue")
3. Animating the Scene
To animate the motion capture data, we loop over each frame and update the points of each mesh. We then render the plotter and write the current frame to a file.
for num in range(1, num_frames):
    mean_position = np.array([0.0, 0.0, 0.0])
    for body_part, mesh in zip(body_parts, body_part_meshes):
        x = df.loc[num, f'{body_part}_x']
        y = df.loc[num, f'{body_part}_y']
        z = df.loc[num, f'{body_part}_z']
        mesh.points = pv.Sphere(radius=5, center=(x, y, z)).points
        mean_position += np.array([x, y, z])
    mean_position /= len(body_parts)
    plotter.camera.focal_point = mean_position.tolist()

    for connection, mesh in zip(skeleton, skeleton_line_meshes):
        part1 = connection[0]
        part2 = connection[1]
        x1, y1, z1 = df.loc[num, f'{part1}_x'], df.loc[num, f'{part1}_y'], df.loc[num, f'{part1}_z']
        x2, y2, z2 = df.loc[num, f'{part2}_x'], df.loc[num, f'{part2}_y'], df.loc[num, f'{part2}_z']
        mesh.points = pv.Line((x1, y1, z1), (x2, y2, z2)).points

    plotter.write_frame()
4. Putting It All Together
Finally, we put all the code together and run the script. The script will generate a series of PNG files in the current directory. We can then use FFmpeg to convert the PNG files into a video file.
df = pd.read_csv(r'C:\Users\pc\PycharmProjects\RWKV_for_rat\notebooks\mocap_data_interpolated_mod.csv')
body_parts = list(set(col.split('_')[0] for col in df.columns if '_' in col))
num_frames = len(df)
skeleton = [                    #defining the skeletal structure for plotting skeletal lines.
    ['HeadF', 'HeadB'],
    ['HeadB', 'HeadL'],
    ['HeadF', 'HeadL'],
    ['HeadF', 'SpineF'],
    ['HeadB', 'SpineF'],
    ['HeadL', 'SpineF'],
    ['SpineF', 'SpineM'],
    ['SpineM', 'SpineL'],
    ['SpineF', 'Offset1'],
    ['Offset1', 'Offset2'],
    ['Offset1', 'SpineM'],
    ['Offset2', 'SpineL'],
    ['Offset2', 'SpineM'],
    ['SpineF', 'ShoulderL'],
    ['SpineF', 'ShoulderR'],
    ['ShoulderL', 'ElbowL'],
    ['ArmL', 'ElbowL'],
    ['ShoulderR', 'ElbowR'],
    ['ArmR', 'ElbowR'],
    ['SpineL', 'HipL'],
    ['SpineL', 'HipR'],
    ['HipL', 'KneeL'],
    ['KneeL', 'ShinL'],
    ['HipR', 'KneeR'],
    ['KneeR', 'ShinR']
]

# Assuming that our data is in a csv file wiht the following format:
# Each row represents a frame and we have 3 columns for each body part (x, y, z)

import pyvista as pv
import numpy as np
import time
from matplotlib.cm import get_cmap

def create_body_part_mesh(x, y, z, radius=5):
    """Create a sphere mesh representing a body part."""
    return pv.Sphere(radius=radius, center=(x, y, z))

def create_skeleton_line(x1, y1, z1, x2, y2, z2):
    """Create a line mesh representing a skeleton connection."""
    return pv.Line((x1, y1, z1), (x2, y2, z2))

#Initialize the plotter
plotter = pv.Plotter(notebook=False, off_screen=False)
plotter.open_gif("rat.gif")
# Assuming you have a suitable frame rate for your data
frame_rate = 30

body_part_meshes = []
skeleton_line_meshes = []


# Get a color map
colormap = get_cmap("tab20")

# Normalize the colormap from 0 to 1
normalize = lambda val: (val - 0) / (1 - 0)

# Assuming min_val and max_val are the minimum and maximum values for the data range
# If your data ranges from 0 to N (where N > 0), you can set min_val = 0 and max_val = N

body_part_colors = [colormap(i) for i in range(len(body_parts))]


# Create initial meshes
for body_part, color in zip(body_parts, body_part_colors):
    x = df.loc[0, f'{body_part}_x']
    y = df.loc[0, f'{body_part}_y']
    z = df.loc[0, f'{body_part}_z']
    mesh = create_body_part_mesh(x, y, z)
    plotter.add_mesh(mesh, color=color)
    body_part_meshes.append(mesh)

for connection in skeleton:
    part1 = connection[0]
    part2 = connection[1]
    x1, y1, z1 = df.loc[0, f'{part1}_x'], df.loc[0, f'{part1}_y'], df.loc[0, f'{part1}_z']
    x2, y2, z2 = df.loc[0, f'{part2}_x'], df.loc[0, f'{part2}_y'], df.loc[0, f'{part2}_z']
    skl_mesh = create_skeleton_line(x1, y1, z1, x2, y2, z2)
    plotter.add_mesh(skl_mesh, color="black", line_width=2)
    skeleton_line_meshes.append(skl_mesh)

# Loop over each frame
for num in range(1, num_frames): # start from 1 as we already plotted the first frame
    # Update each body part
    mean_position = np.array([0.0, 0.0, 0.0])
    for body_part, mesh in zip(body_parts, body_part_meshes):
        x = df.loc[num, f'{body_part}_x']
        y = df.loc[num, f'{body_part}_y']
        z = df.loc[num, f'{body_part}_z']
        mesh.points = pv.Sphere(radius=5, center=(x, y, z)).points  # Update points of existing mesh
        mean_position += np.array([x, y, z])

    mean_position /= len(body_parts)  # Calculate mean position of all body parts
    plotter.camera.focal_point = mean_position.tolist()  # Update the camera focal point

    # Update each skeleton connection
    for connection, mesh in zip(skeleton, skeleton_line_meshes):
        part1 = connection[0]
        part2 = connection[1]
        x1, y1, z1 = df.loc[num, f'{part1}_x'], df.loc[num, f'{part1}_y'], df.loc[num, f'{part1}_z']
        x2, y2, z2 = df.loc[num, f'{part2}_x'], df.loc[num, f'{part2}_y'], df.loc[num, f'{part2}_z']
        mesh.points = pv.Line((x1, y1, z1), (x2, y2, z2)).points  # Update points of existing mesh

    plotter.write_frame()  # Write the current frame
plotter.close()

5. Conclusion
In this post, we’ve explored how to use PyVista to visualize and animate 3D motion capture data with high frame rate. By leveraging the power of PyVista, we can create compelling visualizations that not only bring our data to life but also provide deep insights into the underlying dynamicsand animations with high frame rates, making it an excellent choice for visualizing motion capture data.
Share on
Twitter Facebook LinkedInComments are configured with provider: facebook, but are disabled in non-production environments.

